NSX Load Balancer 502 Bad Gateway: Header Size Limits, Logs and Edge CLI Checks

NSX native load balancer returns 502 Bad Gateway? Check the header size limits in the HTTP application profile, find the 502 in the Edge LB error and access logs, and verify pool and server-side SSL.

Short answer: A 502 Bad Gateway from the NSX native load balancer means the virtual server accepted the client request but did not get a usable response from the pool member. A frequent cause is a header that is larger than the limit set in the HTTP application profile, typically large response headers or cookies from the application. Raise the request and response header size in the profile (Networking > Load Balancing > Profiles > Application), and confirm the cause in the load balancer error log and access log on the Edge.

Which 5xx error points where

ErrorUsual meaning on the NSX LBCheck first
502 Bad GatewayThe member answered with something the LB could not use, or closed the connection.Header size limits, server-side SSL, the application on the member
503 Service UnavailableNo pool member is available.Health monitor and pool status
504 Gateway TimeoutThe member did not answer in time.Response timeout in the HTTP profile, application performance
400 Bad RequestThe client request itself was rejected, for example a request header over the limit.Request header size, client cookies

Cause: header size over the limit

The HTTP application profile has two limits: Request Header Size and Response Header Size. When the application returns headers larger than the response limit, which happens with large cookies, long redirect URLs, many Set-Cookie headers or big authentication tokens, the load balancer cannot pass the response on and the client gets a 502. Requests with oversized headers, for example a browser that sends a pile of cookies, fail in a similar way on the request side.

Typical signs: only some users or only some URLs fail (often after login, when the session cookie or token is set), the backend log shows the request as successful, and the LB log shows the 502.

Fix: in the NSX Manager UI, open Networking > Load Balancing > Profiles > Application, edit the HTTP profile used by the virtual server and raise Request Header Size and Response Header Size (values in bytes). Raise them to what the application really needs rather than to the maximum, and use a dedicated profile for that application so other virtual servers keep the default.

Other common causes of 502

  • Server-side SSL mismatch: the pool members listen on HTTPS but the virtual server has no server SSL profile, or the other way round. The LB then speaks the wrong protocol to the member.
  • Member resets the connection: the application crashes or a firewall on the member drops the connection from the SNAT address of the load balancer.
  • Health monitor too weak: a TCP monitor marks the member up while the application behind the port is broken. Use an HTTP or HTTPS monitor that checks a real URL and response code.

Edge CLI checks

On the Edge node that runs the load balancer (the active Edge of the Tier-1 gateway it is attached to):

get load-balancers
get load-balancer <lb-uuid> status
get load-balancer <lb-uuid> virtual-servers status
get load-balancer <lb-uuid> pools status
get load-balancer <lb-uuid> health-check-table

# logs straight from the CLI
get load-balancer <lb-uuid> error-log reg-filter 502
get load-balancer <lb-uuid> virtual-server <vs-uuid> access-log follow

# built-in diagnosis
get load-balancer <lb-uuid> diagnosis summary

Logs on the NSX Edge

Load balancer error log

From the root shell of the Edge, each load balancer has its own log folder under /var/log/lb/ with an error.log. Search it for the 502 and for the reason around it:

grep -r "502" /var/log/lb/ | tail -20
grep -ri "too big header\|upstream" /var/log/lb/ | tail -20

A line with HTTP/1.1 502 Bad Gateway confirms that the load balancer generated the error itself. Error log entries that mention a header that is too big while reading the response from the upstream (the pool member) point straight to the response header size limit.

Access log in syslog

When access logging is enabled on the virtual server, every request is written to /var/log/syslog on the Edge with subcomp="lb" and s2comp="access":

grep 's2comp="access"' /var/log/syslog | grep "HttpResponse.Status: '502'" | tail -20

Each entry is a full record of the request: virtual server name, IP and port, pool and the pool member that handled it, client IP, SNAT IP and port, HTTP method, URI and host, and the response status, size and server time. That tells you which member and which URL return the 502. A response size of 0 together with a long server time means the member never sent a usable response.

Further reading

NSX East-West Connectivity: VMs on the Same Segment Cannot Talk Across ESX Hosts

VMs on the same NSX segment talk on one host but not across hosts? Check TEP-to-TEP connectivity and MTU with vmkping, read tunnel BFD state in vmkernel.log and uplink events in vobd.log.

Short answer: When VMs on the same NSX overlay segment can talk while they sit on one ESX host, but not when they run on different hosts, the Geneve tunnel between the two hosts’ TEPs is not working. Either the TEPs cannot reach each other, or the path between them does not carry the larger encapsulated packets because of an MTU mismatch. Test it with vmkping ++netstack=vxlan -d -s 1572 <remote-TEP>, then read the tunnel state in /var/log/vmkernel.log and the uplink events in /var/log/vobd.log.

Why the TEP path matters

Two VMs on the same host never leave the host, so their traffic does not touch the physical network. As soon as they run on different hosts, every frame is wrapped in Geneve by the TEP (a vmkernel interface on the overlay transport zone) and sent to the TEP of the other host over the TEP VLAN. Geneve adds at least 50 bytes of headers, plus options, so a full 1500-byte VM frame needs a larger MTU on every hop. NSX needs at least 1600 and recommends 1700; VCF designs typically use 9000.

This gives a quick first test: migrate both VMs to the same host. If they can talk there but not across hosts, the problem is the TEP path, not the VMs, the segment or the firewall.

Step 1: find the TEPs

On each ESX host, list the TEP interfaces of the overlay TCP/IP stack (named vxlan for historical reasons):

esxcli network ip interface ipv4 get -N vxlan
esxcli network ip interface list -N vxlan        # vmk10, vmk11 ... with their MTU
esxcli network ip route ipv4 list -N vxlan       # TEP gateway if TEPs are in different subnets

Or from NSX Manager: get transport-node <uuid> vtep. In the UI, System > Fabric > Hosts shows the tunnels of each host with their status.

Step 2: test TEP-to-TEP reachability and MTU

Ping the remote TEP from the overlay stack, first with a small packet, then with the largest packet your design allows and fragmentation disabled (-d). The size is the MTU minus 28 bytes of IP and ICMP headers:

vmkping ++netstack=vxlan <remote-TEP-ip>                  # basic reachability
vmkping ++netstack=vxlan -d -s 1572 <remote-TEP-ip>       # MTU 1600
vmkping ++netstack=vxlan -d -s 1672 <remote-TEP-ip>       # MTU 1700
vmkping ++netstack=vxlan -d -s 8972 <remote-TEP-ip>       # MTU 9000

# with several TEPs, test each source interface
vmkping ++netstack=vxlan -I vmk11 -d -s 1572 <remote-TEP-ip>
ResultMeaningCheck
Small ping failsNo IP path between the TEPsTEP VLAN on the physical switch ports, TEP IP pool and gateway, routing between TEP subnets
Small ping works, large ping failsMTU too small somewhere on the pathVDS MTU, NSX uplink profile or global MTU, physical switch ports, and the router or SVI between TEP subnets
Both workThe TEP path is fineSegment configuration, distributed firewall rules, the VM itself

Check the MTU on every layer: the vSphere Distributed Switch, the MTU in the NSX uplink profile (or the global tunnel MTU), the physical switch ports toward all hosts, and, if TEP subnets are routed, the router interfaces between them. One switch port or one SVI with 1500 is enough to break east-west traffic while small packets, such as ping and ARP, still work.

Step 3: read the host logs

/var/log/vmkernel.log: tunnel BFD state

NSX runs BFD over each Geneve tunnel to know whether the remote TEP is alive. Every state change is logged:

grep BFD_HandleStatusChange /var/log/vmkernel.log | tail -20

Each line names the local and remote TEP, the old and new state, a diagnostic code and the tunnel type (overlay). The diagnostic Control Detection Time Expired means BFD packets from the remote TEP stopped arriving within the detection time, which points to loss on the TEP path. Lines that flap between down and up for the same remote TEP usually mean an unstable uplink or a link with drops.

/var/log/vobd.log: uplinks and redundancy

vobd records physical uplinks going down or up and the loss or return of uplink redundancy on distributed switch ports:

grep -E "uplink.transition|connectivity|redundancy" /var/log/vobd.log | tail -30
esxcli network nic list

Look for vob.net.dvport.uplink.transition.down or lost redundancy around the time the tunnels went down. Match the timestamps with the BFD lines in vmkernel.log: if an uplink went down first, start with the cable, the NIC, the switch port or the teaming policy that maps TEPs to uplinks.

If the TEP path is fine

  • Check that both VMs are really attached to the same segment and that both hosts are in the overlay transport zone of that segment.
  • Check the distributed firewall rules applied to both VMs; see the NSX distributed firewall CLI.
  • Check that the host agents are running, so that the host received the segment configuration; see troubleshooting NSX host agents.

Further reading

Designing the TEP and uplink layout from scratch on Cisco UCS? See NSX Edge design on Cisco UCS for NSX 4.x and VCF 9.

NSX BGP Neighbor Not Established: Troubleshooting Tier-0 BGP on the NSX Edge

Why a Tier-0 BGP session to the ToR does not come up (VLAN ID or BGP configuration mismatch), how to check it from the NSX Edge CLI, and how to read frr.log and syslog.

Short answer: When the BGP session between a Tier-0 gateway uplink and the top-of-rack switch does not come up, the cause is almost always one of two mismatches: the VLAN ID of the Edge uplink does not match the VLAN on the ToR interface, so there is no layer 2 path, or the BGP settings (neighbor IP, AS numbers, password, timers) do not match on both sides. Check the session state with get bgp neighbor summary in the Tier-0 SR context on the Edge, then read /var/log/frr/frr.log for the exact reason.

Start with the BGP state

Log in to the Edge node that runs the Tier-0 SR, find the SR and enter its VRF context:

get logical-routers
vrf <vrf-id-of-the-TIER0-SR>
get bgp neighbor summary
get bgp neighbor <peer-ip>
get interfaces

The state in the summary tells you where to look:

StateWhat it meansLook at
Idle, Connect, ActiveThe TCP session on port 179 never comes up.Layer 2 and IP reachability: uplink VLAN, IP and subnet, firewall or ACL on the ToR.
OpenSent, OpenConfirmTCP works, but the peers reject each other’s OPEN message.BGP parameters: AS numbers, neighbor IP, password, capabilities.
Established, then dropsThe session flaps.Hold timer, BFD, MTU, physical link or Edge resources.

Two more commands do much of the analysis for you: get bgp neighbor <peer-ip> session-diagnostics and get bgp-bfd diagnostics report.

Cause 1: VLAN ID mismatch on the uplink

The Tier-0 uplink interface sits on a VLAN segment, and that VLAN has to arrive tagged at the ToR interface where the BGP peer IP lives. If the VLAN ID differs anywhere on the path, the two sides never see each other and the session stays in Idle or Active. Check every hop:

  • The VLAN ID of the NSX uplink segment used by the Tier-0 interface.
  • The trunk port group or VLAN range on the vSphere Distributed Switch that carries the Edge uplinks (for an Edge VM), or the Edge uplink profile and teaming for a bare-metal Edge.
  • The physical switch port toward the ESX host or Edge, which must allow the VLAN, and the SVI or routed sub-interface on the ToR that holds the peer IP.

Then test reachability from the Tier-0 SR context, sourced from the uplink IP:

ping <peer-ip> source <tier0-uplink-ip> repeat 5

No reply means the problem is below BGP; fix the VLAN, IP or subnet first. Add size 1472 dfbit enable to the ping to check that a full 1500-byte packet passes; an MTU mismatch typically lets the session come up and then drop when larger UPDATE messages are sent.

Cause 2: BGP configuration mismatch

If ping works but the session does not establish, compare the Tier-0 BGP configuration with the ToR line by line:

  • Local AS on the Tier-0 and remote AS on the ToR neighbor, and the other way round.
  • Neighbor IP addresses: the ToR must peer with the Tier-0 uplink IP, and the Tier-0 with the ToR interface IP (or loopback, with multihop set on both sides).
  • MD5 password: set on both sides or on neither.
  • Keepalive and hold timers, and BFD: enabled on both sides with compatible intervals.
  • Address families (IPv4, IPv6, EVPN) enabled on both sides.

Logs on the NSX Edge

The Edge keeps two logs that explain BGP state changes. Read them from the root shell of the Edge node.

/var/log/frr/frr.log

The routing daemon log. It records every FSM transition of a neighbor and the reason for it:

grep -E "bgp_fsm_change_status|ADJCHANGE" /var/log/frr/frr.log | tail -30
grep -i "notification" /var/log/frr/frr.log | tail -30

A good session ends with the peer going from OpenConfirm to Established and an %ADJCHANGE: neighbor <peer-ip> in vrf default Up line. When it goes down, look at the reason next to it:

Message in the logMeaning
Network or config errorGeneral failure; check connectivity, the VLAN path, firewall rules and the configuration.
NOTIFICATION code 4 (Hold Timer Expired)No keepalive or update within the hold time: packet loss, congestion, MTU, or a peer that stopped answering.
NOTIFICATION code 2 (OPEN Message Error)The OPEN was rejected, for example a wrong peer AS (subcode 2).
Administratively down (NSXA_OP_STATE_DOWN)The neighbor is disabled in the NSX configuration.
BFD downBFD detected the path failure first and took BGP down with it; check get bfd-sessions.

/var/log/syslog

The NSX routing service raises an alarm for each BGP state change of a Tier-0 SR. Filter it to get a clean timeline per peer:

grep "state=BGP" /var/log/syslog

Each line names the peer IP, the SR and the new state: BGP_UP, BGP_DOWN or BGP_DELETE. Match the timestamps with frr.log and with the ToR log to see which side dropped first.

Further reading

For the Edge uplink, named teaming and ToR peering design on Cisco UCS, see NSX Edge design on Cisco UCS for NSX 4.x and VCF 9.

NSX Host Agents on ESX: Troubleshooting nsx-proxy, nsx-opsagent, nsx-cfgagent and nsx-nestdb

Host Down or Host Disconnected in NSX? Which NSX host agent is behind it (nsx-proxy, nsx-opsagent, nsx-cfgagent, nsx-nestdb), how to check and restart it on ESX, and which logs to read.

Short answer: When a transport node shows Down in the NSX UI, one of the local agents that apply and report configuration (nsx-cfgagent, nsx-opsagent or nsx-nestdb) has usually stopped or crashed. When it shows Host Disconnected, look first at nsx-proxy, the agent that holds the connection to NSX Manager. Check the agent with /etc/init.d/<agent> status, start or restart it, then confirm the manager and controller connections and read /var/run/log/nsx-syslog.log.

The NSX agents on an ESX host

When you prepare a host for NSX, several user-space agents are installed next to the NSX kernel modules. Four of them matter most when a host goes red in the UI:

AgentWhat it doesIf it stops
nsx-proxyHolds the TLS connections from the host to NSX Manager (TCP 1234) and to the central control plane (TCP 1235) and passes messages to the other agents.The host loses its connection to the managers: Host Disconnected.
nsx-cfgagentReceives the desired configuration (segments, routing, firewall) and programs it into the kernel datapath.New or changed configuration is not applied; host status goes Down.
nsx-opsagentReports operational state and status of the transport node back to NSX Manager and handles VM port attachments.The manager gets no status from the host; host status goes Down.
nsx-nestdbLocal database on the host where the agents keep the configuration they received.The other agents cannot read or store configuration; host status goes Down.

The agents are management and control plane. Traffic that is already programmed into the kernel keeps flowing while an agent is down, but nothing new reaches the host: no new segments, no firewall rule changes, no vMotion of VMs onto NSX ports that the host does not know yet.

Symptom 1: host is Down in the NSX UI

In System > Fabric > Hosts the transport node shows Down, while the host itself is up in vCenter. The usual cause is that nsx-cfgagent, nsx-opsagent or nsx-nestdb stopped or crashed. Check all agents in one go from the ESX shell:

for a in nsx-proxy nsx-cfgagent nsx-opsagent nsx-nestdb; do
  echo "== $a"; /etc/init.d/$a status
done

Start the agent that is not running, or restart it if it is running but the node stays Down:

/etc/init.d/nsx-opsagent start
/etc/init.d/nsx-cfgagent restart
/etc/init.d/nsx-nestdb status

Restart one agent at a time and wait a minute before you look at the UI again; the node status is refreshed by the next report from the host. On ESX the NSX CLI has no restart service command (that is for Manager and Edge), so /etc/init.d is the way.

Symptom 2: Host Disconnected

The NSX configuration of the host shows Host Disconnected. Here the host cannot talk to NSX Manager at all, which points to nsx-proxy or to the network path between the host and the managers.

/etc/init.d/nsx-proxy status
/etc/init.d/nsx-proxy restart

# Which managers and controllers does the host use, and is it connected?
nsxcli -c get managers
nsxcli -c get controllers

# TCP sessions to NSX Manager (1234) and the central control plane (1235)
esxcli network ip connection list | grep -E ':1234|:1235'

If nsx-proxy runs but there is no ESTABLISHED session on 1234 and 1235, the problem is not the agent: check routing and firewalls between the ESX management network and the NSX Manager nodes (or the cluster VIP), DNS, and the manager certificates. For the full list of host-side NSX CLI commands see the NSX CLI interactive mindmap with the ESXi node filter.

Logs: nsx-syslog.log

All four agents write to /var/run/log/nsx-syslog.log on the host (/var/log is a link to /var/run/log). Filter by agent name to see why it stopped:

grep -i "nestdb"    /var/run/log/nsx-syslog.log | tail -50
grep -i "cfgagent"  /var/run/log/nsx-syslog.log | tail -50
grep -i "opsagent"  /var/run/log/nsx-syslog.log | tail -50

# nsx-proxy: the connection to the managers, filtered by a manager IP
grep -i "<nsx-manager-ip>" /var/run/log/nsx-syslog.log | tail -20

A healthy nsx-proxy logs a heartbeat about once a minute, with subcomp="nsx-proxy" and a line like MessagingClientService: Heartbeat message received … from endpoint: ssl://<manager-ip>:1234. If the heartbeats stop at a certain time, that is when the host lost the manager; look at the lines just before it for TLS, certificate or connection errors.

For more detail while you reproduce the problem, raise the nsx-proxy log level and set it back afterwards:

nsxcli -c get service nsx-proxy logging-level
nsxcli -c set service nsx-proxy logging-level debug
# ... reproduce ...
nsxcli -c set service nsx-proxy logging-level info

If the agent keeps stopping

  • Check for core dumps in /var/core: a crashing agent leaves one there each time.
  • Check that the host is not short of memory or that its scratch/OSDATA partition is not full; agents fail to start when they cannot write their state.
  • Compare the NSX VIB version on the host (esxcli software vib list | grep -i nsx) with the NSX Manager version; a half-finished upgrade often shows up as agents that crash after start.
  • Collect a support bundle for the host from NSX Manager before you reboot it, so the logs and cores are kept for Broadcom support.

Further reading

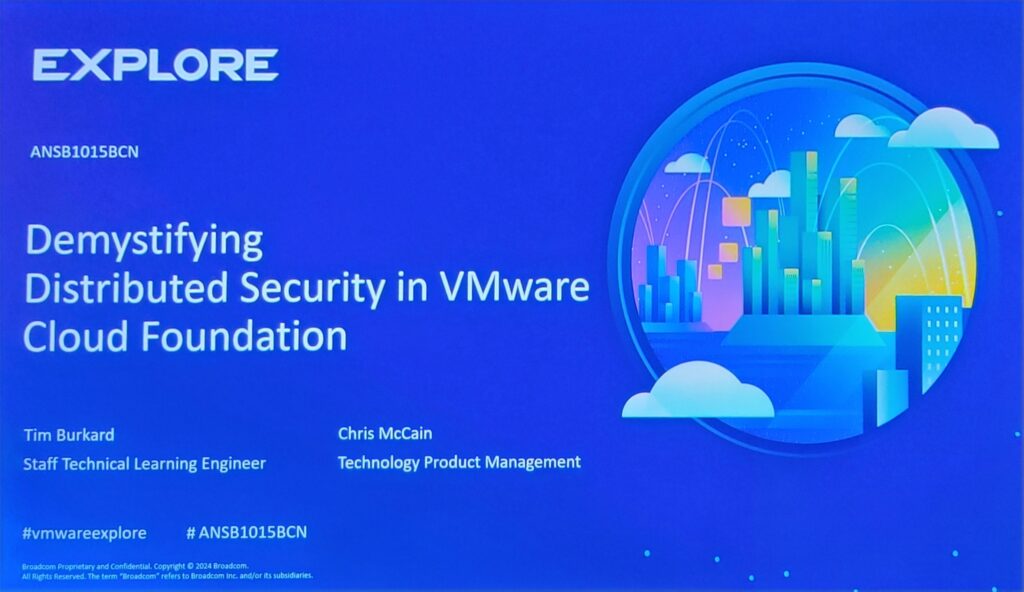
Demystifying Distributed Security in VMware Cloud Foundation

How VMware Cloud Foundation approaches distributed security with NSX, based on the VMware Explore EU 2024 session and what it means for VCF designs.

In today’s evolving IT landscape, securing distributed environments is crucial. VMware Cloud Foundation (VCF) addresses these challenges head-on with its Distributed Security model. During the VMware Explore EU 2024 session titled “Demystifying Distributed Security in VMware Cloud Foundation,” experts Chris McCain, Tim Burkard explored the nuances of enhancing security within VCF environments.

Key NOTES:

  1. vDefend Distributed Protection:
    • This is VMware’s approach to ensuring secure communication between virtual machines (VMs) by enforcing strict security rules. The Distributed Firewall (DFW) policies, integral to vDefend, apply a Zero Trust model, allowing only authorized traffic and rejecting any unauthorized attempts.
  2. Granular Security Policies:
    • VCF’s Distributed Firewall offers granular control over security policies, allowing IT teams to define rules at both policy and individual VM levels. This flexibility ensures that security is tightly integrated into every layer of the infrastructure.
  3. Intrusion Detection and Prevention:
    • VMware’s Distributed Intrusion Detection and Prevention (IDP) system proactively monitors and prevents unauthorized activities. The IDP uses an extensive signature database to alert or block threats, ensuring real-time protection across the data center.
  4. Built-in Tools for Validation and Troubleshooting:
    • Tools like Traceflow and Live Traffic Analysis are pivotal for monitoring and validating security rules. These tools help IT professionals ensure that the DFW is functioning as intended and that traffic flow complies with security policies.

ESXi Hosts: The Data Plane

ESXi hosts, where VMs reside, are integral to enforcing NSX DFW rules. The following CLI commands can be run on ESXi hosts to manage and troubleshoot DFW settings at the host level:

  • List All the VMs dvFilter Names: Use summarize-dvfilter to list all dvFilters associated with VMs. dvFilters are kernel modules that apply firewall rules to VMs’ network traffic.
  • View IP and MAC Addresses for a dvFilter: To see the IP and MAC addresses related to a specific dvFilter, the command is
    vsipioctl getaddrsets -f <dvfilter-name>
  • List the Firewall Rules Applied on DvFilter: Retrieve the set of firewall rules applied to a dvFilter by executing
    vsipioctl getrules -f <dvfilter-name>
  • View Firewall Configuration for a dvFilter: To inspect the firewall configuration for a specific dvFilter, the command is
    vsipioctl getfwconfig -f <dvfilter-name>

NSX-T CLI on my blog.

Harnessing Remote Logging for Enhanced NSX Component Management

NSX remote logging not configured? Set a syslog server on NSX Manager and Edge with set logging-server, check it with get logging-servers, find local logs.

Short answer: if NSX reports that remote logging is not configured, or you simply want central logs, point each component at your syslog server. On NSX Manager run set logging-server <IP/FQDN:port> proto udp level info, on NSX Edge the same with proto tcp, and check with get logging-servers. ESXi hosts log NSX events to /var/log/nsx-syslog.log, so forward those through the host’s own syslog settings. All set logging-server options and the other NSX CLI commands per version are in the NSX CLI interactive mindmap.

This blog post delves into the configuration of NSX components for remote Syslog transfer, a critical step in centralizing log management and enhancing network visibility.

Local Logging on NSX Components

By default, NSX components store logs locally, which can be accessed in privileged mode. These logs are crucial for troubleshooting and auditing purposes, offering insights into the system’s operations and potential issues. The default storage location for these logs is the /var/log directory. Here’s a quick overview of the log files and their locations for various NSX components:

  • NSX Manager: Logs are stored in
    /var/log/syslog,
    /var/log/proton/nsxapi.log, and
    /var/log/nsx-audit.log
  • NSX Edge: The primary log file is located at /var/log/syslog.
  • NSX Controller: Logs can be found in /var/log/cloudnet/nsx-ccp.log.
  • ESXi Host: Logs are stored in /var/log/nsx-syslog.log.

Configuring Remote Logging

To leverage the full potential of logging, configuring NSX components to transfer logs to a remote Syslog server is advisable. This allows for centralized log management, making it easier to monitor and analyze the logs from various components in a single location. Here are the commands to configure logging to a remote Syslog server for different NSX components:

  • NSX Manager:
    • Set command:
      set logging-server <IP Address/fqdn:Port> proto udp level info
    • Verify command:
      get logging-servers
  • NSX Edge:
    • Set command:
      set logging-server <IP Address/fqdn:Port> proto tcp level info
    • Verify command:
      get logging-servers

These commands should be executed with the appropriate IP address, fully qualified domain name (FQDN), and port of your Syslog server, alongside the protocol and log level specified. The choice between TCP and UDP protocols depends on your requirements for log delivery confirmation and network overhead. Generally, TCP is used when acknowledgment of log receipt is required, while UDP is used for lower network overhead.

NSX Installation and Essential Commands Guide

Essential NSX commands on NSX Manager and ESXi: transport node status, TEP/VTEP info, VIFs, NSX VIBs and agents, vmkping over the TEP stack, and log files.

Short answer: the NSX commands you need most are get transport-nodes status, get transport-node <uuid> vtep and get transport-node <uuid> vifs on NSX Manager; on the ESXi host, esxcli software vib list | grep nsx, vmkping ++netstack=vxlan for TEP connectivity, and esxcli network ip connection list to check the agent connections (port 1234 to NSX Manager, 1235 to the controllers). The log files to watch are listed at the end.

This guide provides a concise overview of essential commands to manage NSX effectively. For deeper dives, see NSX logical switching commands, NSX logical routing and diagnostics, the NSX management cluster and the NSX distributed firewall CLI. To look up any NSX CLI command by version and node type (Manager, Edge, ESXi), use the NSX CLI interactive mindmap.

NSX Manager Commands

The NSX Manager is the centralized network management component of VMware NSX, offering an intuitive interface for managing the network and security settings across your virtual environment. Below are key commands you can run from the NSX Manager CLI:

  • List all ESXi hosts to get the Transport Node UUIDs: To view all ESXi hosts registered with NSX, and their respective Transport Node UUIDs, use
    get transport-nodes status
    This command is vital for identifying nodes for further configuration or troubleshooting.
  • List the Transport Node Status: To check the status of a specific Transport Node, use get transport-node <uuid> status. This command provides insights into the health and connectivity status of the node.
  • List the Transport Node VTEP Information: View the VXLAN Tunnel Endpoint (VTEP) information with get transport-node <uuid> vtep. This is crucial for understanding the overlay network configuration.
  • Lists the VIF UUID of a VM: To find the Virtual Interface (VIF) UUID of a VM connected to a Segment on a Transport Node, use
    get transport-node <uuid> vifs
    This command is useful for troubleshooting VM connectivity issues.

Commands Run from ESXi Host

Directly interacting with ESXi hosts is sometimes necessary for detailed troubleshooting or configuration. Here are commands specific to NSX that you can run on ESXi hosts:

  • List the VIBs installed on ESXi: To see all NSX-installed VMware Installation Bundles (VIBs) on an ESXi host, use esxcli software vib list | grep nsx.
  • List all the NSX modules currently loaded in the system: Check which NSX modules are active with esxcli system module list | grep nsx.
  • Check the User World Agents (UWA) Status: For nsx-mpa, nsx-proxy, and nsx-opsagent, use /etc/init.d/nsx-<agent> status to verify if these agents are running correctly. When a host shows Down or Host Disconnected in NSX, see troubleshooting NSX host agents.
  • Check UWAs Connection: Use
    esxcli network ip connection list | grep <port number> to check connections to the NSX Controllers (Port 1235) and NSX Manager (Port 1234).

ESXi Host Networking Commands

Network configuration and troubleshooting directly on ESXi hosts are facilitated by the following commands:

  • List Physical NICs/vmnic: esxcli network nic list gives a summary of all physical NICs.
  • Physical NIC Details: Use esxcli network nic get -n <vmnic-id> for detailed information about a specific NIC.
  • List vmk NICs: For IP addresses, MAC, MTU, and other details, use
    esxcli network ip interface ipv4 get.
  • Details of vxlan IP Stack: To view the VXLAN-dedicated IP stack configuration, use esxcli network ip interface list --netstack=vxlan.
  • Ping from a VXLAN TCP/IP Stack: vmkping ++netstack=vxlan x.x.x.x allows testing connectivity using the VXLAN stack.
  • View VXLAN-dedicated TCP/IP Stack’s Routing and ARP Tables: Use
    esxcli network ip route ipv4 list -N vxlan and
    esxcli network ip neighbor list -N vxlan respectively.

NSX Installation Log Files

Troubleshooting NSX installations requires access to specific log files:

On NSX Manager:

  • View Log Files: Use get log-file manager.log follow or
    get log-file syslog follow to tail the NSX Manager logs in real-time.

On ESXi Hosts:

  • Installation and Host-related Logs: Located at /var/log/esxupdate.log for installation activities, /var/log/vmkernel.log for host issues, and
    /var/log/vmksummary.log, /var/log/vmkwarning.log for VMkernel warnings and messages. Module load failures are captured in /var/log/syslog.log.

Mastering the NSX Management Cluster: Essential Commands and Log Files

Manage the NSX Manager cluster from the CLI: cluster status and config, detach and join manager nodes, and the NSX Manager log files for troubleshooting.

Short answer: check NSX Manager cluster health with get cluster status and its setup with get cluster config. Remove a manager with detach node <ID>, and add one with join <primary-IP> cluster-id <ID> thumbprint <thumbprint> username admin password <password>. The log files to read when something breaks are listed at the end. Every other NSX Manager command, by NSX version, is in the NSX CLI interactive mindmap.

This blog post dives into the essential commands for managing the NSX Management Cluster and explores the key log files within the NSX Manager to ensure you’re equipped to maintain and troubleshoot your setup effectively.

Understanding the NSX Management Cluster

Essential Commands for NSX Management Cluster

To help you navigate the management of the NSX Management Cluster, here are some indispensable commands you should be familiar with:

Querying Cluster Status

  • Command: get cluster status
  • Description: This command allows you to check the current status of the NSX management cluster, providing insights into its health and operational state.

Querying Cluster Configuration

  • Command: get cluster config
  • Description: Use this command to obtain the configuration details of the NSX management cluster. It’s essential for verifying the current setup and planning any necessary adjustments.

Detaching a Manager Node

  • Command: detach node <ID>
  • Description: If you need to remove a Manager node from the cluster, this command lets you safely detach it, ensuring no disruption to the cluster’s operation.

Adding a New Manager Node

  • Command:
    join <Primary Manager Node IP> cluster-id <ID> thumbprint <Primary Manager Node Thumbprint> username admin password <admin password>
  • Description: This command is crucial for scaling or repairing the NSX management cluster. It allows you to add a new Manager node to the cluster, enhancing its resilience and capacity.

Key Log Files in NSX Manager

For effective troubleshooting and monitoring of the NSX Management Cluster, understanding how to access and interpret log files is crucial. Here are the essential log files within the NSX Manager:

NSX Manager Logs

  • Access Command: get log-file manager.log follow
  • Location & Description: This log provides detailed records of the operations and events within the NSX Manager, offering invaluable insights for troubleshooting.

Syslog Files

  • Access Command: get log-file syslog follow
  • Location & Description: The syslog files capture a wide range of system messages, including errors, warnings, and operational information, which are critical for diagnosing issues within the cluster.

Understanding and Utilizing NSX Distributed Firewall through CLI Commands

NSX DFW from the CLI: firewall status, rule summary and exclude list on NSX Manager, per-host checks on ESXi, DFW log files and gateway firewall on Edge.

Short answer: the NSX Distributed Firewall commands you’ll use most are get firewall status, get firewall summary and get firewall exclude-list on NSX Manager, then the per-host checks on ESXi (the data plane that enforces the rules), the DFW log files, and the gateway firewall commands on NSX Edge. Each is described below; all other firewall commands per NSX version and node type are in the NSX CLI interactive mindmap.

This blog post aims to elucidate the essential command-line interface (CLI) commands for managing the NSX Distributed Firewall, focusing on commands that can be executed from the NSX Manager and ESXi hosts, as well as detailing relevant log files for troubleshooting and auditing purposes. Additionally, we’ll touch upon commands for managing gateway firewall settings on NSX Edge devices.

NSX Manager: The Central Control Plane

The NSX Manager serves as the centralized control plane for managing NSX environments, offering a unified interface for configuring and monitoring network virtualization and security settings. Here are some key CLI commands you can run directly from the NSX Manager:

  • View the Rule Count of L2, L3 Firewall Rules: To get a summary of Layer 2 and Layer 3 firewall rules, use the command get firewall summary
    This command provides a quick overview of the rules in place, helping administrators gauge the extent of their firewall configurations.
  • List of Firewall Entities in the Excluded List: To view the entities excluded from firewall protection, execute get firewall exclude-list
    This command is crucial for identifying assets that are intentionally bypassed by firewall rules for specific purposes.
  • Firewall Status: Checking the overall status of the firewall is as simple as running get firewall status
    This command confirms whether the distributed firewall is operational and can help in troubleshooting connectivity issues.

ESXi Hosts: The Data Plane

ESXi hosts, where VMs reside, are integral to enforcing NSX DFW rules. The following CLI commands can be run on ESXi hosts to manage and troubleshoot DFW settings at the host level:

  • List All the VMs dvFilter Names: Use summarize-dvfilter to list all dvFilters associated with VMs. dvFilters are kernel modules that apply firewall rules to VMs’ network traffic.
  • View IP and MAC Addresses for a dvFilter: To see the IP and MAC addresses related to a specific dvFilter, the command is
    vsipioctl getaddrsets -f <dvfilter-name>
  • List the Firewall Rules Applied on DvFilter: Retrieve the set of firewall rules applied to a dvFilter by executing
    vsipioctl getrules -f <dvfilter-name>
  • View Firewall Configuration for a dvFilter: To inspect the firewall configuration for a specific dvFilter, the command is
    vsipioctl getfwconfig -f <dvfilter-name>

Log Files: The Insight Tools

Log files play a pivotal role in monitoring, troubleshooting, and auditing. Here are essential log file locations for NSX components:

  • NSX Syslog Log File on ESXi: Located at /var/log/nsx-syslog.log, this file captures a wide range of NSX-related events and is invaluable for troubleshooting.

Gateway Firewall: NSX Edge Commands

NSX Edge devices provide gateway services, including firewalling for north-south traffic. Here’s how to manage gateway firewall settings via CLI:

  • Query Interfaces with Firewall Rules:
    get firewall interfaces lists all edge interfaces with configured firewall rules.
  • Query Gateway Firewall Rules: For specific interface rules, use
    get firewall <interface-uuid> ruleset rules

Simplifying Network Operations with NSX-T: A Guide to Logical Routing and Diagnostics

NSX logical routing troubleshooting from the CLI: gateways, interfaces and routes on NSX Manager, BGP and OSPF on the Edge (vrf), and checks on ESXi hosts.

Short answer: to troubleshoot NSX routing, start on NSX Manager with get gateways, get gateway <uuid> interfaces and get gateway <uuid> route. Then go to the Edge node, enter the Tier-0 service router with vrf <ID>, and check get bgp neighbor or the OSPF equivalents. Finish on the ESXi host to confirm what the distributed router actually programmed. All commands are listed below; for every other NSX CLI command (all gateway, BGP and OSPF variants by version), see the NSX CLI interactive mindmap.

This blog post delves into the logical routing capabilities of NSX-T and how network administrators can harness the power of NSX Manager and Edge CLI commands to efficiently manage and troubleshoot their network infrastructure.

NSX Manager: Your Gateway to Network Management

NSX Manager serves as the centralized network management console in VMware’s NSX-T architecture. From listing gateways to viewing detailed route information, NSX Manager equips administrators with the tools they need to manage their network effectively.

Key Commands from NSX Manager:

  • List All Gateways: Easily view all the gateways within your network with
    get gateways
  • Gateway Details: For specifics about a gateway, use
    get gateway <uuid>
  • Interface Management: View a gateway’s interfaces using get gateway <uuid> interfaces and get detailed interface information with
    get gateway <uuid> interface <interface-id>
  • Routing Information: Access route details on a gateway with
    get gateway <uuid> route
  • NSX Edge Node Status: Check the status of NSX Edge nodes registered with the NSX Manager using get transport-node status

Edge CLI: Deep Dive into Gateway Diagnostics

The Edge CLI is your go-to for an in-depth analysis and diagnostics of gateways. Whether you’re monitoring gateway statistics or reviewing BGP and OSPF configurations, the Edge CLI commands offer a granular view of network operations.

View the gateway BGP information:

  • Gateway Overview: get gateways provides a list of all gateways.
  • To enter into the VRF construct: vrf <ID>
  • View the bgp neighbor of a Tier-0 SR:
    (Tier-0)> get bgp neighbor
  • View the interfaces on a Tier-0 SR:
    (Tier-0)> get interfaces
  • View the forwarding table:
    (Tier-0)> get forwarding
  • View the Routes:
    (Tier-0)> get route
  • View the BFG configuration:
    (Tier-0)> get bfd-config

View the gateway OSPF information

  • To enter into the VRF construct: vrf <ID>
  • View the bgp neighbor of a Tier-0 SR:
    (Tier-0)> get ospf neighbor
  • View the details of the OSPF interface:
    (Tier-0)> get ospf interface
  • View the forwarding table:
    (Tier-0)> get forwarding
  • View the Routes:
    (Tier-0)> get route
  • View the OSPF database:
    (Tier-0)> get ospf database

  • Statistics and Neighbors: Use get gateway <uuid> stats for statistics and
    get gateway <uuid> neighbor to view neighbor details.
  • BGP and OSPF Configurations: Enter the VRF construct with
    vrf <ID> to view BGP neighbors, OSPF interfaces, and routing information.

ESXi Host-Level Insights

At the ESXi host level, NSX-T extends its capabilities to provide essential diagnostics and log file access, ensuring administrators have all the necessary tools at their fingertips.

Commands Run from ESXi:

  • Forwarding Table and Interfaces: View the gateway’s forwarding table and interfaces with get gateway <UUID> forwarding and
    get gateway <UUID> interfaces.
  • Neighbors: To see a gateway’s neighbors, use
    get gateway <UUID> neighbors.

Log Files on ESXi:

  • NSX Syslog Log File: Located at /var/log/nsx-syslog.log, this log file is critical for troubleshooting and understanding the events within your NSX environment.