Introducing Project Cypress
Project Cypress integrates generative AI into VMware’s lateral security solution, acting as a co-pilot when investigating threats.
Daniel Micanek virtual Blog – Like normal Dan, but virtual.
Project Cypress integrates generative AI into VMware’s lateral security solution, acting as a co-pilot when investigating threats.
A few weeks back, I had a request from one of our Technical Adoption Managers (TAM) that their customer wanted to create a custom ESXi VIB that could be used with vSphere Lifecycle Manager (vLCM) and would only require the ESXi host to reboot as part of the remediation. This might sound like […]
ESXi Scripted Installation (Kickstart) has been my go-to method for achieving zero-touch provisioning of ESXi hosts at scale, which I had started using back in the ESX 2.5 days when I was a customer! Having worked at some very larger enterprises, I got the opportunity to experience and manage […]
I’ve had this question twice in about a week, which means that it is time to write a quick post. How do you stop vCLS VMs from running on a vSphere HA Failover Host? For those who don’t know, a vSphere HA Failover Host is a host which is used when a failure has occurred […]
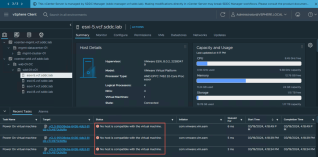
After deploying a new VMware Cloud Foundation (VCF) Workload Domain using the VCF Holodeck Toolkit, which leverages Nested ESXi, I noticed the vSphere Cluster Services (vCLS) VMs kept failing to power on and threw the following error message: No host is compatible with the virtual machine I […]
This blog post delves into the configuration of NSX components for remote Syslog transfer, a critical step in centralizing log management and enhancing network visibility.
By default, NSX components store logs locally, which can be accessed in privileged mode. These logs are crucial for troubleshooting and auditing purposes, offering insights into the system’s operations and potential issues. The default storage location for these logs is the /var/log directory. Here’s a quick overview of the log files and their locations for various NSX components:
/var/log/syslog, /var/log/proton/nsxapi.log, and /var/log/nsx-audit.log/var/log/syslog./var/log/cloudnet/nsx-ccp.log./var/log/nsx-syslog.log.To leverage the full potential of logging, configuring NSX components to transfer logs to a remote Syslog server is advisable. This allows for centralized log management, making it easier to monitor and analyze the logs from various components in a single location. Here are the commands to configure logging to a remote Syslog server for different NSX components:
set logging-server <IP Address/fqdn:Port> proto udp level infoget logging-serversset logging-server <IP Address/fqdn:Port> proto tcp level infoget logging-serversThese commands should be executed with the appropriate IP address, fully qualified domain name (FQDN), and port of your Syslog server, alongside the protocol and log level specified. The choice between TCP and UDP protocols depends on your requirements for log delivery confirmation and network overhead. Generally, TCP is used when acknowledgment of log receipt is required, while UDP is used for lower network overhead.
This guide provides a concise overview of essential commands to manage NSX effectively.
The NSX Manager is the centralized network management component of VMware NSX, offering an intuitive interface for managing the network and security settings across your virtual environment. Below are key commands you can run from the NSX Manager CLI:
get transport-nodes statusget transport-node <uuid> status. This command provides insights into the health and connectivity status of the node.get transport-node <uuid> vtep. This is crucial for understanding the overlay network configuration.get transport-node <uuid> vifs Directly interacting with ESXi hosts is sometimes necessary for detailed troubleshooting or configuration. Here are commands specific to NSX that you can run on ESXi hosts:
esxcli software vib list | grep nsx.esxcli system module list | grep nsx./etc/init.d/nsx-<agent> status to verify if these agents are running correctly.esxcli network ip connection list | grep <port number> to check connections to the NSX Controllers (Port 1235) and NSX Manager (Port 1234).Network configuration and troubleshooting directly on ESXi hosts are facilitated by the following commands:
esxcli network nic list gives a summary of all physical NICs.esxcli network nic get -n <vmnic-id> for detailed information about a specific NIC.esxcli network ip interface ipv4 get.esxcli network ip interface list --netstack=vxlan.vmkping ++netstack=vxlan x.x.x.x allows testing connectivity using the VXLAN stack.esxcli network ip route ipv4 list -N vxlan and esxcli network ip neighbor list -N vxlan respectively.Troubleshooting NSX installations requires access to specific log files:
get log-file manager.log follow or get log-file syslog follow to tail the NSX Manager logs in real-time./var/log/esxupdate.log for installation activities, /var/log/vmkernel.log for host issues, and /var/log/vmksummary.log, /var/log/vmkwarning.log for VMkernel warnings and messages. Module load failures are captured in /var/log/syslog.log.This blog post dives into the essential commands for managing the NSX Management Cluster and explores the key log files within the NSX Manager to ensure you’re equipped to maintain and troubleshoot your setup effectively.
To help you navigate the management of the NSX Management Cluster, here are some indispensable commands you should be familiar with:
get cluster statusget cluster configdetach node <ID>join <Primary Manager Node IP> cluster-id <ID> thumbprint <Primary Manager Node Thumbprint> username admin password <admin password>For effective troubleshooting and monitoring of the NSX Management Cluster, understanding how to access and interpret log files is crucial. Here are the essential log files within the NSX Manager:
get log-file manager.log followget log-file syslog followThis blog post aims to elucidate the essential command-line interface (CLI) commands for managing the NSX Distributed Firewall, focusing on commands that can be executed from the NSX Manager and ESXi hosts, as well as detailing relevant log files for troubleshooting and auditing purposes. Additionally, we’ll touch upon commands for managing gateway firewall settings on NSX Edge devices.
The NSX Manager serves as the centralized control plane for managing NSX environments, offering a unified interface for configuring and monitoring network virtualization and security settings. Here are some key CLI commands you can run directly from the NSX Manager:
get firewall summary get firewall exclude-listget firewall statusESXi hosts, where VMs reside, are integral to enforcing NSX DFW rules. The following CLI commands can be run on ESXi hosts to manage and troubleshoot DFW settings at the host level:
summarize-dvfilter to list all dvFilters associated with VMs. dvFilters are kernel modules that apply firewall rules to VMs’ network traffic.vsipioctl getaddrsets -f <dvfilter-name>vsipioctl getrules -f <dvfilter-name>vsipioctl getfwconfig -f <dvfilter-name>Log files play a pivotal role in monitoring, troubleshooting, and auditing. Here are essential log file locations for NSX components:
/var/log/nsx-syslog.log, this file captures a wide range of NSX-related events and is invaluable for troubleshooting.NSX Edge devices provide gateway services, including firewalling for north-south traffic. Here’s how to manage gateway firewall settings via CLI:
get firewall interfaces lists all edge interfaces with configured firewall rules.get firewall <interface-uuid> ruleset rulesThis blog post delves into the logical routing capabilities of NSX-T and how network administrators can harness the power of NSX Manager and Edge CLI commands to efficiently manage and troubleshoot their network infrastructure.
NSX Manager serves as the centralized network management console in VMware’s NSX-T architecture. From listing gateways to viewing detailed route information, NSX Manager equips administrators with the tools they need to manage their network effectively.
Key Commands from NSX Manager:
get gatewaysget gateway <uuid>get gateway <uuid> interfaces and get detailed interface information with get gateway <uuid> interface <interface-id>get gateway <uuid> routeget transport-node statusThe Edge CLI is your go-to for an in-depth analysis and diagnostics of gateways. Whether you’re monitoring gateway statistics or reviewing BGP and OSPF configurations, the Edge CLI commands offer a granular view of network operations.
get gateways provides a list of all gateways.vrf <ID>(Tier-0)> get bgp neighbor(Tier-0)> get interfaces(Tier-0)> get forwarding(Tier-0)> get route(Tier-0)> get bfd-configvrf <ID>(Tier-0)> get ospf neighbor(Tier-0)> get ospf interface(Tier-0)> get forwarding(Tier-0)> get route(Tier-0)> get ospf databaseget gateway <uuid> stats for statistics and get gateway <uuid> neighbor to view neighbor details.vrf <ID> to view BGP neighbors, OSPF interfaces, and routing information.At the ESXi host level, NSX-T extends its capabilities to provide essential diagnostics and log file access, ensuring administrators have all the necessary tools at their fingertips.
Commands Run from ESXi:
get gateway <UUID> forwarding and get gateway <UUID> interfaces.get gateway <UUID> neighbors.Log Files on ESXi:
/var/log/nsx-syslog.log, this log file is critical for troubleshooting and understanding the events within your NSX environment.